
Insights
Insights turns your bookings into answers: when you’re busy, what sells, who comes back, and where money is leaking.
Choosing a period
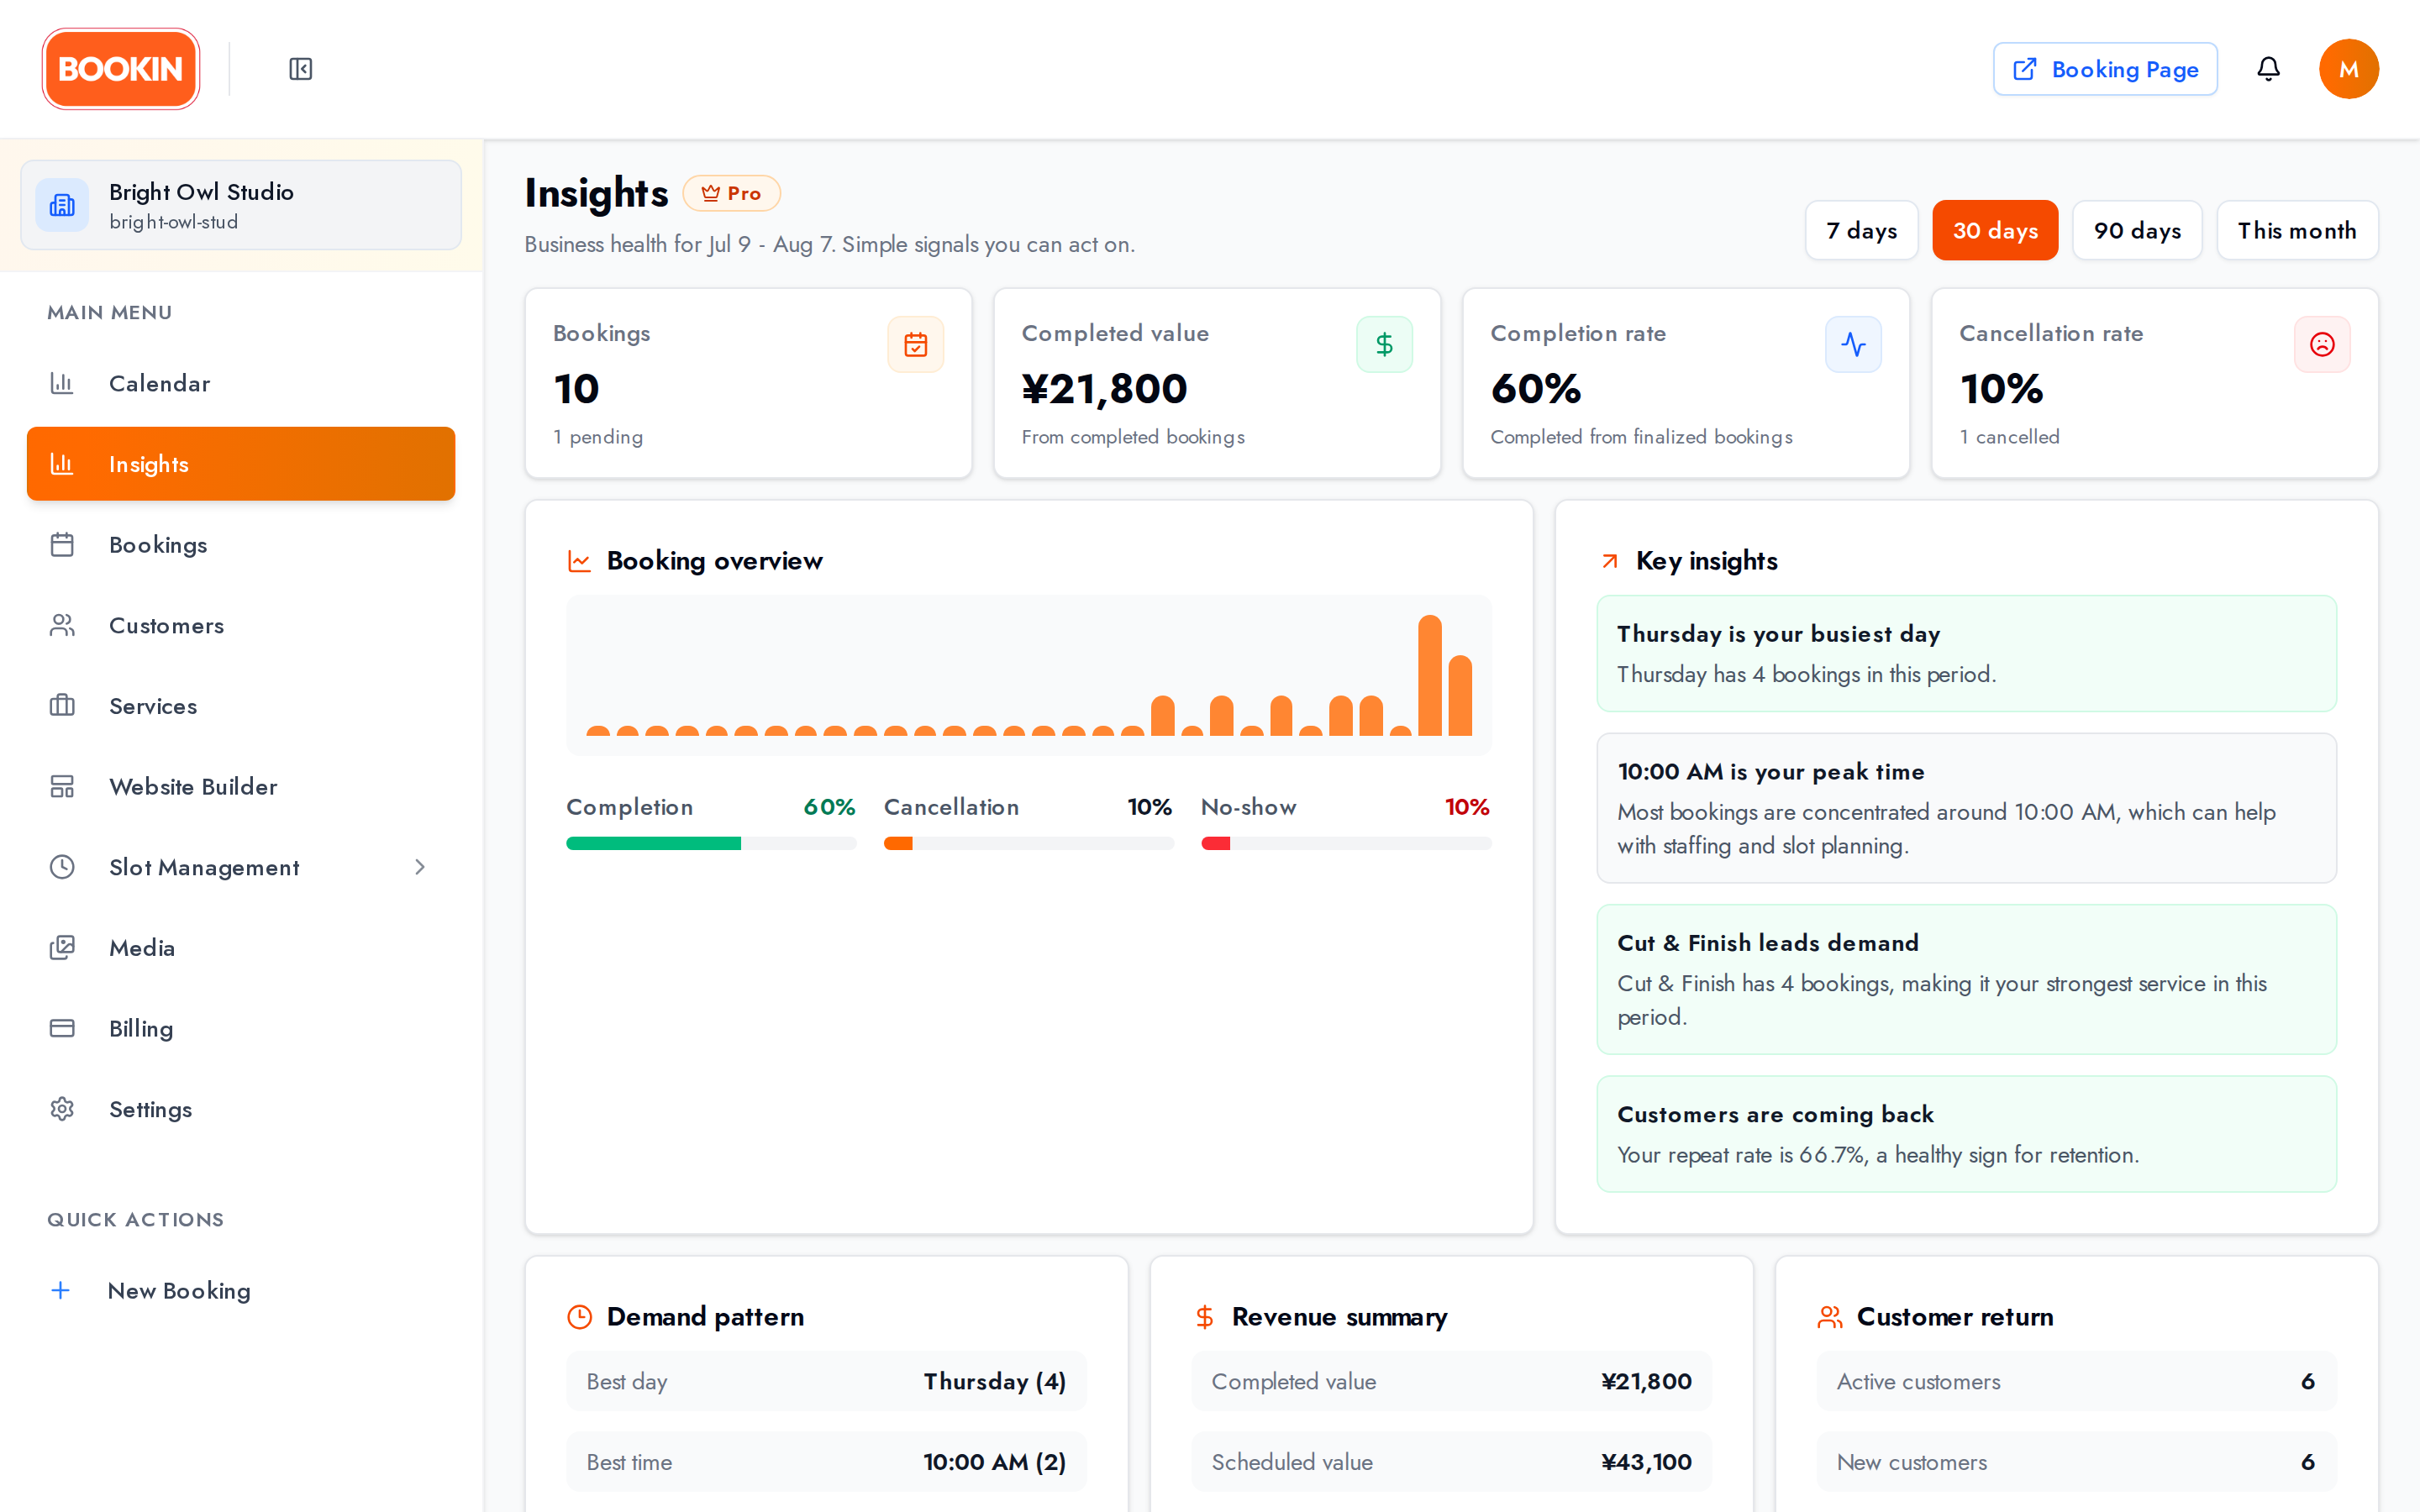
Section titled “Choosing a period”Every number responds to the range you pick: 7 days, 30 days, 90 days, or This month.
Compare like with like. A 7-day view during a quiet week isn’t evidence of a trend.
The four headline numbers
Section titled “The four headline numbers”| Tile | What it tells you |
|---|---|
| Bookings | Total in the period, with pending ones called out separately |
| Completed value | Money from bookings you actually delivered |
| Completion rate | Share of bookings that ended as completed |
| Cancellation rate | Share that were cancelled |
The pending count is the actionable one — it’s work sitting in your queue waiting for you to confirm it.
Booking overview
Section titled “Booking overview”How bookings moved over the period, so you can see growth or a dip in shape rather than in a single number.
Key insights
Section titled “Key insights”BOOKIN writes short observations from your own data — “Wednesday is your busiest day”, “14:00 is your peak time”, or “Cancellations need attention — your cancellation rate is 22%. Consider reminders, clearer policies, or deposit options.”
They’re starting points, not verdicts. A high cancellation rate at one time of day usually means something specific.
Three rates broken out: completion, cancellation and no-show.
Keeping these honest depends on you marking bookings correctly. If you cancel a booking the customer simply didn’t turn up for, your no-show rate reads as zero and you lose the ability to spot the pattern. See Managing Appointments.
Demand pattern
Section titled “Demand pattern”- Best day and quietest day
- Best time — your peak booking hour
- Average per day
- Days with no bookings
This is the section that changes decisions. Quiet days are candidates for shorter hours or a promotion; peak times are where extra capacity pays for itself.
Days with no bookings are worth checking against your schedule — sometimes the answer is that you were closed, and sometimes it’s that nobody could find a slot.
Revenue summary
Section titled “Revenue summary”| Figure | Meaning |
|---|---|
| Completed value | Delivered and done |
| Scheduled value | Booked but not yet delivered |
| Lost value | Cancellations and no-shows |
| Average completed booking | Typical value per delivered appointment |
Lost value is the number worth watching. It puts a figure on your no-shows, which is what makes reminders and deposit policies easy to justify.
Customer return
Section titled “Customer return”- Active customers in the period
- New customers
- Returning customers
- Repeat rate
For most service businesses, moving the repeat rate costs less than finding new customers. If it’s low, your follow-up booking habit is the first thing to look at.
Top services and service value
Section titled “Top services and service value”Which services get booked most, and which bring in the most money — not always the same list. A popular low-priced service and a rare high-value one need different responses.
Making Insights trustworthy
Section titled “Making Insights trustworthy”The reports are only as good as your record-keeping:
- Mark bookings completed promptly — otherwise completed value understates your business.
- Use No Show rather than cancelling for absent customers.
- Give cancellation reasons, so a rising rate has an explanation attached.
- Price your services accurately, since revenue figures come from booking prices.
Related Guides
Section titled “Related Guides”- Dashboard Overview - Where everything lives
- Managing Appointments - Statuses that feed these reports
- Managing Customers - Follow-ups and repeat business
- Billing & Pricing - Plan requirements